CS 115 Lab 5, Part D: Find turning points
[Back to lab instructions]
Introduction
You now have a solution that can detect if the second point of two consecutive points of a
sequence is moving downward or upward. In this version, you will detect the turning
points. That is, you will determine if we have just seen a peak or a valley.
We defined these terms in the pre-lab.
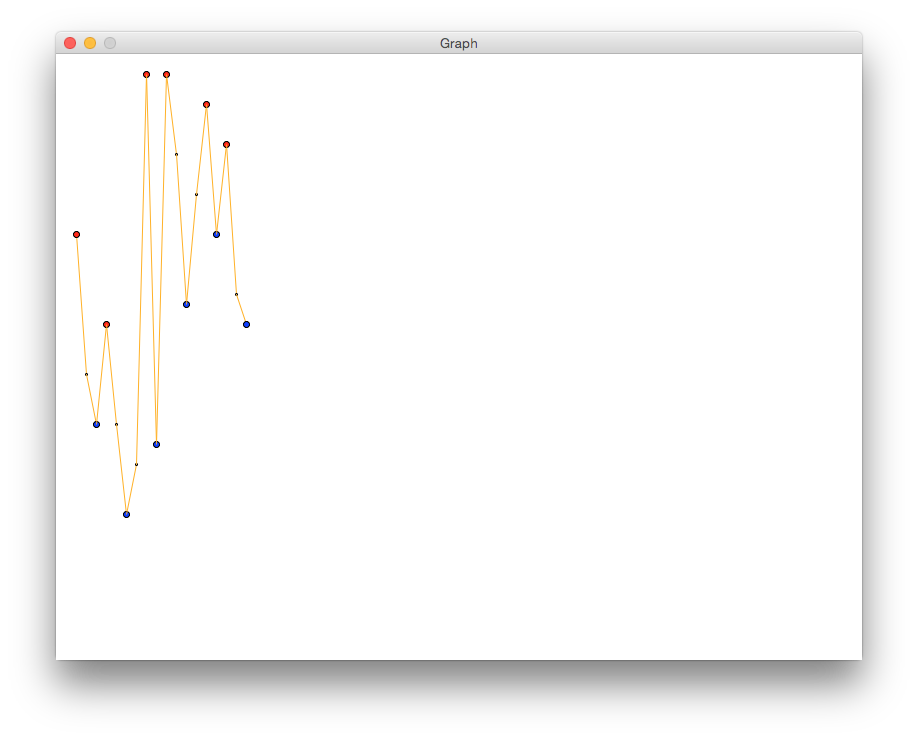
You will color points that are valleys in blue and points that are peaks in red.
These points will have radii of 3, instead of a radius of 1 like the other points.
Instructions
- Create a new Python file named lab05d.py:
"""
Program: CS 115 Lab 5d
Author: Your name
Description: This program draws a graph and identifies turning points.
"""
from graphics import *


def main():
    window_height = 600
    window = GraphWin('Graph', 800, window_height)

    # Open the input file and read the number of points
    pointsfile = open("points-test.txt", "r")
    num_points = int(pointsfile.readline())

    x = 20
    first_y = int(pointsfile.readline())   # get the first y-coordinate
    first_point = Point(x, window_height - first_y)

    x += 10
    second_y = int(pointsfile.readline())
    second_point = Point(x, window_height - second_y)

    ########## Complete this code: draw the line between these 2 points

    ########## Fix this if-statement
    if second_y is greater than first_y
      increasing = True
    else:
      increasing = False  # in other words, we're decreasing

    ############
    # Complete this code:
    # Use the value of "increasing" to determine and print whether the first
    # point is a peak or a valley.

    # If it's a peak, draw it in red. If it's a valley, draw it in blue.
    # Use a radius of 3 instead of 1.
    ############

    # Update first_y and first_point
    first_y = second_y
    first_point = second_point

    for i in range(2, num_points):  # already did first 2
       # Read the next point and update x
       x += 10
       second_y = int(pointsfile.readline())
       second_point = Point(x, window_height - second_y)

       ############
       # Copy this code from Part C
       # draw the line between first_point and second_point
       # draw a circle centered at first_point with radius 1
       ############

       ############
       # Complete this code:
       # if the sequence has been increasing:
       #     if first_y is larger than second_y:
       #         we must be at a peak and about to go downward
       #         draw a red circle centered at first_point with radius 3
       #         print that this point is a peak
       # if the sequence has been decreasing:
       #     if first_y is smaller than second_y:
       #         we must be at a valley and about to go upward
       #         draw a blue circle centered at first_point with radius 3
       #         print that this point is a valley
       ############

       ############
       # Think about why this works!
       increasing = second_y > first_y
       ############

       # second_point becomes the first point of the next line
       first_y = second_y
       first_point = second_point

    ###### Complete this code
    # Decide and print whether first_point is a peak or a valley
    # Draw the appropriate circle

    window.getMouse()
    window.close()


main()
- Complete the code where indicated. Your graph should look like the following:
- Add print statements to generate this output:
420 is a peak.
230 is a valley.
330 is a peak.
140 is a valley.
580 is a peak.
210 is a valley.
580 is a peak.
350 is a valley.
550 is a peak.
420 is a valley.
510 is a peak.
330 is a valley.
- In your code, modify the line that opens the input file to:
pointsfile = open("points.txt", "r")
Rerun your program. It should identify 6 peaks and 7 valleys. When that is working, call an instructor to demo your code.
- Make sure that your name is at the top of the file and the docstring has been updated.
- Continue to Part E.