Deadline: Tu 2/17/2015 at 7 AM
for i in range(1, 4):
    for j in range(0, i):
        # end="\t" makes the print statement end with a tab
        # instead of ending the line
        print(i, ',', j, sep="", end="\t")

print()  # Prints a blank line or ends the current line
In Lab 5, you will solve a problem involving points in the Cartesian coordinate system. This is the one you're familiar with from math courses, rather than the one used by the graphics library.
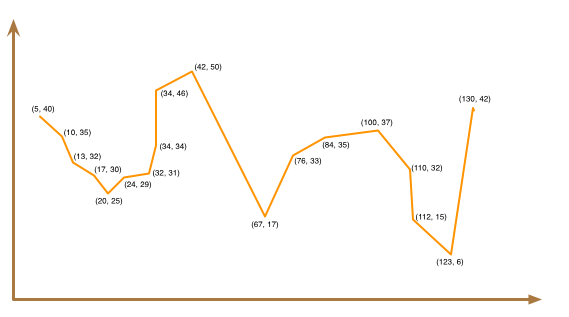
Consider the graph below:
As you move from left to right along the horizontal (x) axis, the y-values fluctuate. For example, you might see a series of y-values that are increasing and then decreasing, and then increasing again, and then decreasing again, etc.
Your eventual job will be to read a sequence of numbers that represent the y-coordinates of consecutive points. Your program will identify the peaks and valleys in the graph represented by these points. You will see a precise definition of peaks and valleys shortly.
You are allowed to assume that two consecutive points will always have different values.
To gain more insight into peaks and valleys, consider the graph below, which has the peaks colored in black and the valleys in blue:
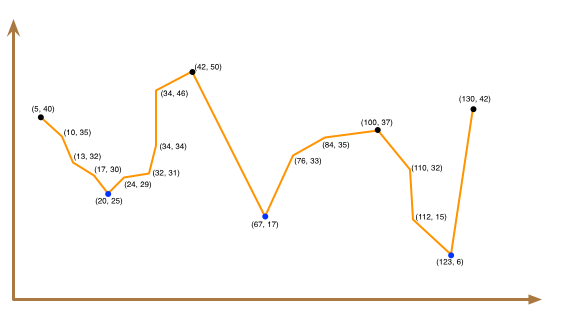
You would want your program to identify 4 peaks and 3 valleys for this dataset.
A peak is a point in the graph whose y-value is larger than the y-values of both of its immediate neighbors.
For example, (42, 50) is a peak because its y-value (50) is greater than its left neighbor's y-value (46) and its right neighbor's y-value (17).
If a point only has one neighbor, we will consider it a peak as long as its y-value is larger than its neighbor's y-value. In the sample graph, the first point is a peak because its y-value (40) is greater than its only neighbor's y-value (35). The last point is also a peak because its y-value (42) is greater than its only neighbor's y-value (6).
The definition of valley is similar: a point is a valley point if its y-value is smaller than the y-values of both of its immediate neighbors.
For example, point (20, 25) is a valley because its y-value (25) is smaller than its left neighbor's y-value (30) and its right neighbor's y-value (29).
Similarly, the first point is a valley if its y-value is smaller than that of the second point. The last point is a valley if its y-value is smaller than that of the second-to-last point.
To get some practice with peaks and valleys, consider the following dataset. This dataset represents the y-values of 20 consecutive points:
14
6
9
28
13
22
4
11
42
18
45
10
14
8
49
42
40
6
8
47
Sketch these points on a piece of paper, and answer Question 4 in your pre-lab.
Review your answers, and then click the Next button at the bottom of the Moodle quiz.
Once you do that, you should see something similar to this:
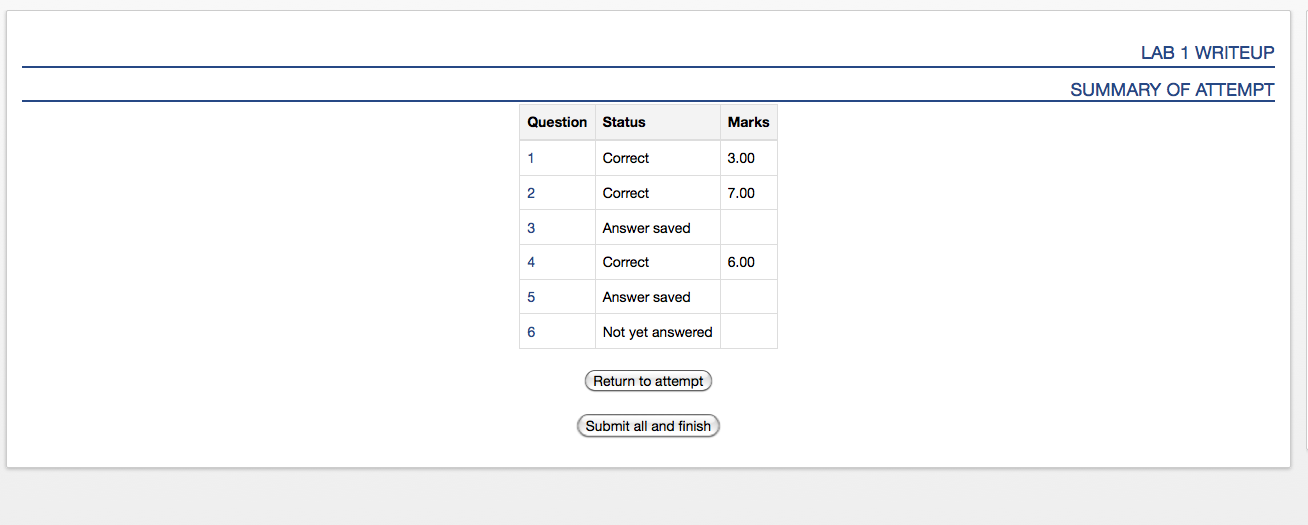
Click the Submit all and finish button. You MUST do this so that your
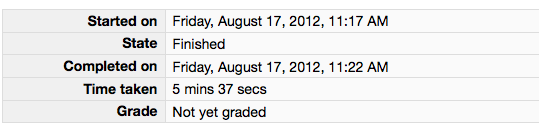
pre-lab can be graded! Once you have submitted your quiz, you should see
something similar to this at the top of your Moodle window. The important part is that the State shows up as Finished.